Mastering Basic Candlestick Patterns: A Practical Trader’s Guide
This guide delivers a complete breakdown of essential candlestick patterns, focusing on practical application rather than theory alone. Traders across stocks, forex, crypto, and commodities rely on these formations because the principles behind them are universal. Within MEXQuick, education is built around clarity, structure, and execution—exactly what candlestick analysis offers when used correctly.
For centuries, traders have searched for a reliable way to read price behavior and anticipate market direction. From early Japanese rice traders to modern digital charts updated in milliseconds, the core challenge remains unchanged—understanding who truly controls the market at any given moment. Price does not move randomly. It reacts to emotion, momentum, and collective decision-making, and candlestick charts capture this behavior with remarkable clarity.
Candlestick patterns condense complex market psychology into visual signals that can be interpreted quickly and effectively. Unlike lagging indicators, they reveal what is happening in real time. Every candle is a record of conflict between buyers and sellers, and when those candles form recognizable structures, they provide valuable insight into potential future movements.
By the end of this guide, identifying patterns will become second nature, but more importantly, understanding why they work will elevate decision-making and risk control.
Understanding Candlestick Patterns
What a Candlestick Represents
A candlestick illustrates price movement over a defined time period, whether minutes or days. Each candle contains four key data points: open, high, low, and close.
- Body: Represents the distance between opening and closing prices
- Bullish body: Close above open
- Bearish body: Close below open
- Wicks (Shadows): Show the highest and lowest prices reached
When candles form in specific arrangements, they reveal shifts in sentiment that can signal continuation or reversal.
Why Candlesticks Matter in Trading
Candlestick charts have endured because they communicate more information than nearly any other charting method.
- They expose momentum instantly
- They reveal hesitation, rejection, and aggression
- They form the foundation of price action strategies
In structured trading environments such as MEXQuick, these patterns are treated as evidence—not predictions—requiring confirmation and context to be effective.
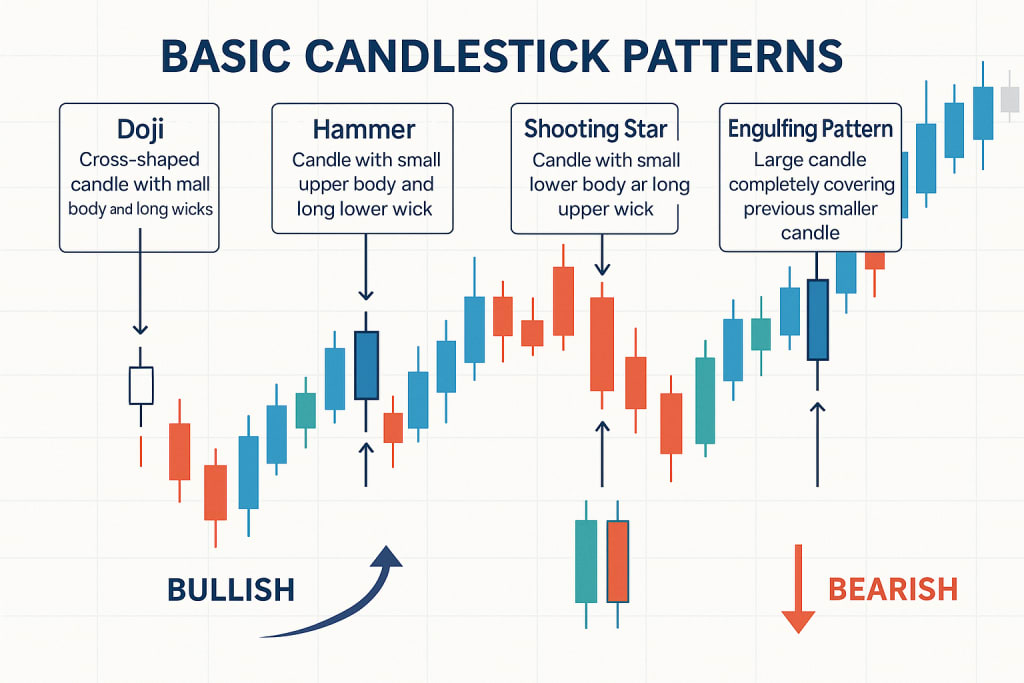
Single Candle Patterns
Doji: Market Indecision
A Doji forms when opening and closing prices are nearly identical. Its appearance signals balance—and potential turning points when it follows strong trends.
Key Insight: The Doji itself is not a trade signal. Its power comes from location, trend, and confirmation.
Common variants include:
- Long-Legged Doji
- Gravestone Doji
- Dragonfly Doji
Within MEXQuick, Doji patterns are evaluated alongside trend exhaustion and volume behavior.
Hammer: Bullish Reversal Signal
The Hammer appears during downtrends and reflects strong rejection of lower prices.
Characteristics:
- Small body near the top
- Long lower wick
- Minimal upper wick
This structure shows sellers lost control after initially driving prices lower.
Execution Logic:
- Must appear after a downtrend
- Requires bullish confirmation
- Stop placed below the wick
When used properly, the Hammer becomes a powerful entry confirmation inside structured systems such as MEXQuick.
Shooting Star: Bearish Reversal Signal
The Shooting Star forms after an uptrend and signals a failed breakout.
Structure:
- Small body near the bottom
- Long upper wick
- Strong rejection of higher prices
This candle reflects buyer exhaustion and aggressive selling pressure—an early warning that momentum is shifting.
Multi-Candle Reversal Patterns
Bullish Engulfing Pattern
A Bullish Engulfing pattern forms during downtrends and signals a strong shift in control from sellers to buyers.
Formation:
- First candle: bearish
- Second candle: bullish and fully engulfs prior body
This pattern demonstrates conviction and often appears near support.
Inside MEXQuick, engulfing patterns are favored when supported by volume and higher-timeframe alignment.
Bearish Engulfing Pattern
The bearish counterpart emerges during uptrends and signals distribution.
It reflects optimism at the open followed by overwhelming selling pressure. When confirmed, it frequently precedes deeper pullbacks or trend reversals.
Morning Star & Evening Star
These three-candle formations provide some of the most reliable reversal signals available.
- Morning Star: Downtrend → indecision → bullish reversal
- Evening Star: Uptrend → indecision → bearish reversal
Their layered psychology aligns naturally with disciplined trading frameworks like those emphasized within MEXQuick.
Context Is Everything
A candlestick pattern without context is noise.
Trend Alignment
Reversal patterns must form against the prevailing trend to be valid.
- Bullish patterns → after decline
- Bearish patterns → after advance
This rule eliminates false signals and protects capital.
Support, Resistance, and Volume
Patterns become exponentially stronger when they form:
- At major support or resistance levels
- With above-average volume
- In alignment with broader market structure
Execution inside MEXQuick prioritizes confluence—never a single factor alone.
From Pattern to Trade
Execution Workflow
- Identify trend
- Mark key levels
- Wait for pattern
- Confirm price action
- Execute with predefined risk
Risk Management
- Stops invalidate patterns, not emotions
- Reward must exceed risk
- Missed entries are ignored
This disciplined approach defines professional trading within MEXQuick.
Common Mistakes to Avoid
- Trading patterns in isolation
- Ignoring higher-timeframe trends
- Over-leveraging on single setups
- Entering without confirmation
Candlesticks are probability tools—not guarantees.
Candlesticks Across Markets
- Forex: Excellent pattern clarity on higher timeframes
- Stocks: Powerful near earnings and key levels
- Crypto: Best on daily and weekly charts
- Commodities: Effective around macro inflection zones
Across all markets, candlestick behavior remains consistent—a principle deeply embedded in the analytical philosophy of MEXQuick.
Conclusion
Candlestick patterns are not secret codes or shortcuts. They are visual representations of human behavior repeated endlessly across markets. Mastery comes from patience, repetition, and disciplined execution.
When combined with trend analysis, support and resistance, and proper risk control, candlesticks become one of the most reliable decision-making tools available.
This structured, no-nonsense approach to market reading reflects the core trading philosophy behind MEXQuick—where clarity replaces guesswork and discipline replaces emotion.